SINARAN OPTIK
  • HOME
  • Our Services
    • Hands-ON Training >
      • 1-Hari OTDR Fiber Optik Praktikal (Melayu)
      • Ujian Kecekapan Fiber Optik
      • 1-Hari Pengujian & Pentauliahan
      • 2-Hari Fiber Optik Praktikal (Melayu)
      • 4-Hari Fiber Optik Praktikal (Melayu)
    • Sijil Kecekapan >
      • MASUK UJIAN CA
    • Accessories >
      • Patchcords
      • Pigtails
      • ProtectionSleeves
    • Test Gears & Tool Kits
    • Fiber Optics Case Studies
  • Contact Us
  • Why Us
    • Trainer's Profile
    • Our Esteemed Clients
    • Hands-ON Training Photos
    • Why Attend Our Fiber Optics Training?
  • My Blogs
    • Fiber Optics Blog
    • Biz Blog (In Malay)

Testing & Commissioning Optical Fiber Link -Part 2

1/6/2017

0 Comments

 
Testing & Commissioning Optical Fiber Link -Part 1 HERE


More Examples on Calculation of Optical Power Budget

Assuming our Multimode Fiber Optics cabling configuration as below :
Picture
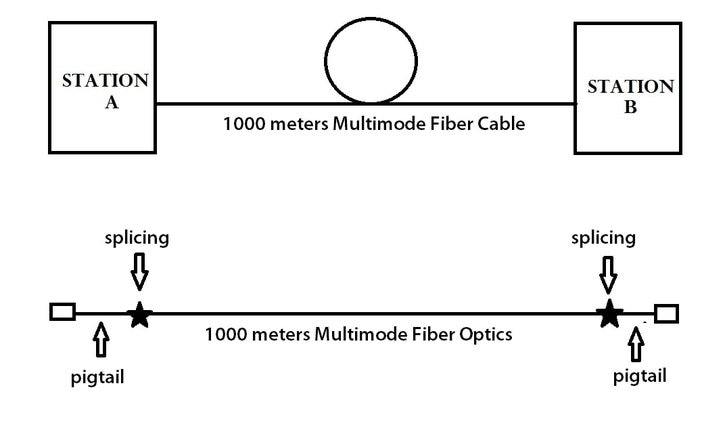
As per Singlemode, there are 2 common operating wavelength namely 850nm and 1300nm.
The respective attenuation or loss as illustrated below :

Picture
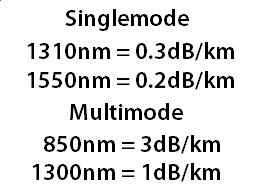
Figure 2 : Operating Wavelength Attenuation

Please refer to the following link for calculation of optical fiber budget formula :-
Testing & Commissioning Optical Fiber Link -
Part 1 HERE

Optical Power Budget Calculation
Using above Figure 1 fiber optics schematic diagram followings can be deduced :
a. Total length of fiber is 1km (please use OTDR to measure actual fiber length)
b. 2 nos of splicings
c. 2 nos of connectors
d. MM operating wavelength of 850 nm - 3dB/km, 1300nm - 1dB/km


Operating Wavelength at 850nm
Maximum Allowable Loss = Fiber Loss + Splicing Loss + Connector Loss

= (1 km x  3 dB/km) + ( 2 x 0.2dB) + ( 2 x 0.5dB)
= 4.4dB

Operating Wavelength at 1300nm
Maximum Allowable Loss = Fiber Loss + Splicing Loss + Connector Loss

= (1 km x 1 dB/km) + ( 2 x 0.2dB) + ( 2 x 0.5dB)
= 2.4dB
  • As such, when we do actual measurement using power meter & light source the measured loss must be less than the calculated allowable maximum loss. 
  • If the actual measurement value is higher than calculated maximum loss then most likely there will no communication or transfer data between Station A and Station B.​
On next articles  we will emphasized on
  • Calculating budget loss if there are jointings or splicings between fiber optics cable 
  • Calculating budget loss if few fiber optics cable are connected via connectors
0 Comments

Testing & Commissioning Optical Fiber Link -Part 1

1/4/2017

2 Comments


Calculation of Optical Power Budget 

What is Optical Power Budget ?
The optical power budget identifies how much attenuation or loss is allowed across a fiber span while still maintaining sufficient output power for the receiver.
Picture
  • Assuming that we are in the planning of installing a singlemode fiber optics cable from point A to point B for our data communication project.
  • Prior to actual fiber implementation we need to calculate before hand the allowable maximum loss  or optical power budget or optical power loss.
Picture
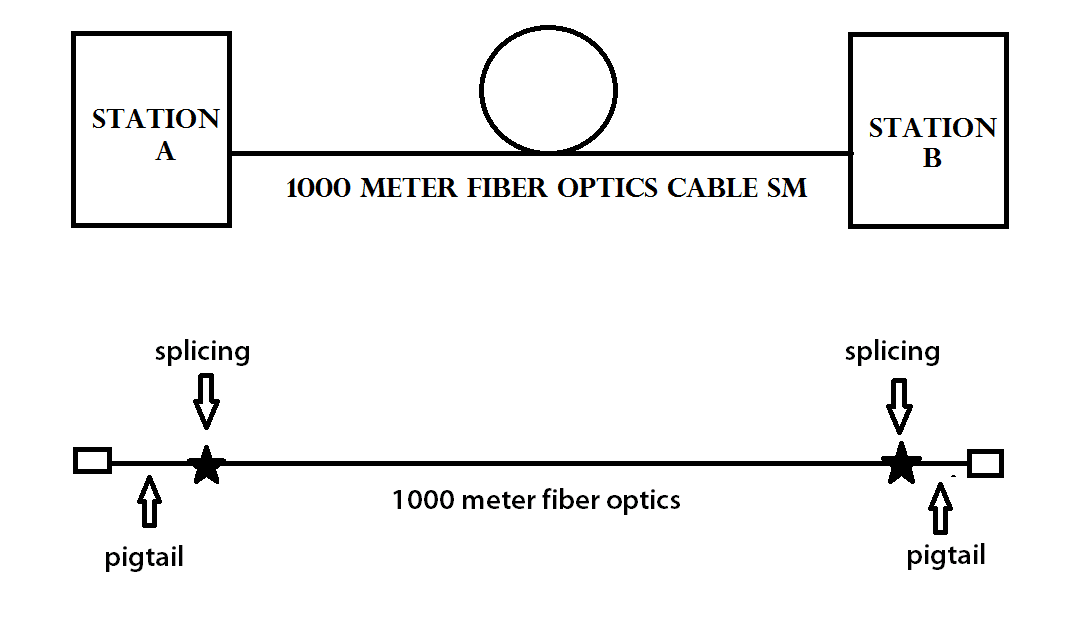
Figure 1 : Cabling Schematic Diagram

  • For Singlemode fiber optics the common operating wavelengths are both 1310nm and 1550nm.
  • For Multimode fiber optics the common operating wavelengths are both 850nm and 1300nm.
  • Based upon manufacturers fiber specification, the attenuation or fiber loss at both operating wave length are as follows :​​
Picture
Figure 2 : Fiber attenuation for both SM and MM

How To Calculate Optical Power Budget ?

  • The Optical Power Budget Loss is equivalent to the total loss of fiber loss + splicing loss + connector loss.
  • ​It is illustrated as below :
Picture
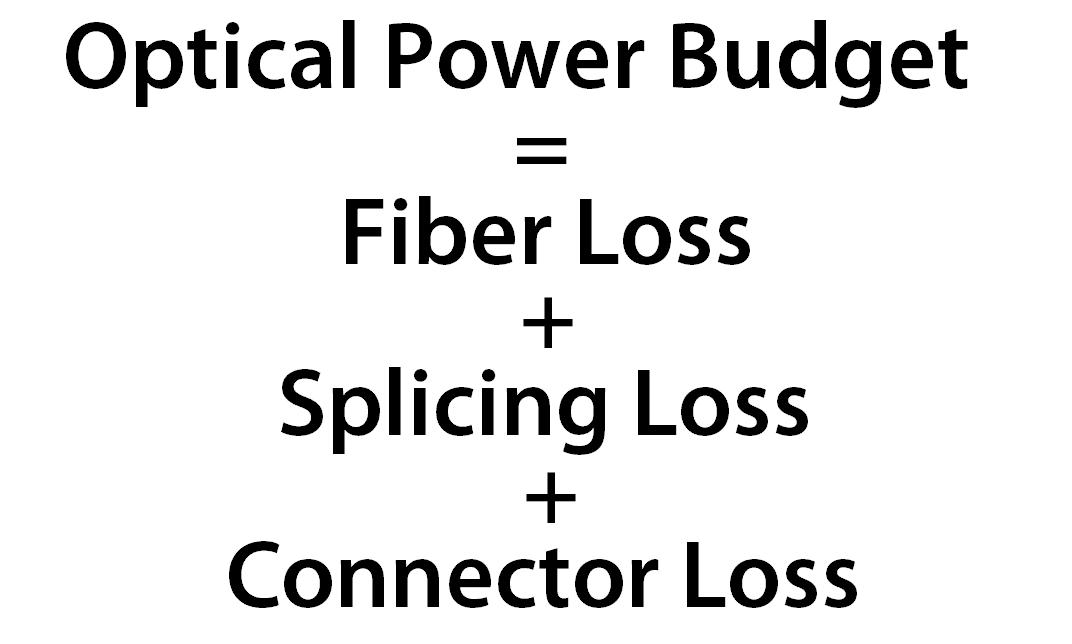
Figure 3 : Optical Power Budget

Fiber Loss = Length of fiber (km) x Attenuation (dB/km)
Length of fiber (km) - to get this value by using OTDR
Attenuation (dB/km) -  SM 1310nm - 0.3dB/km  & SM 1550nm - 0.2dB/km 

                                             MM 850nm - 3dB/km & MM 1300nm - 1 dB/km


Splicing Loss  = No. of splicing  x  Max splicing loss (dB)
No. of splicing  - total number of splicings done from Station A to Station B
Max splicing loss  - as per TIA/EIA recommendation  0.2dB for each splicing

​

Connector Loss  = No. of connector x Max connector loss (dB)
No. of connectors  - total number of  connectors from Station A to Station B
Max connector loss  - as per TIA/EIA recommendation  0.75 dB for  connectors
(but we take maximum connector loss at 0.5dB)


Optical Power Budget Calculation Example

Using above Figure 1 fiber optics schematic diagram followings can be deduced :
a. Total length of fiber is 1km
b. 2 nos of splicings
c. 2 nos of connectors
d. SM operating wavelength of 1310 nm - 0.3dB/km, 1550nm - 0.2dB/km

Operating Wavelength at 1310nm
Maximum Allowable Loss = Fiber Loss + Splicing Loss + Connector Loss

= (1 km x 0.3 dB/km) + ( 2 x 0.2dB) + ( 2 x 0.5dB)
= 1.7dB
Operating Wavelength at 1550nm
Maximum Allowable Loss = Fiber Loss + Splicing Loss + Connector Loss

= (1 km x 0.2 dB/km) + ( 2 x 0.2dB) + ( 2 x 0.5dB)
= 1.6dB
  • As such, when we do actual measurement using power meter & light source the measured loss must be less than the calculated allowable maximum loss. 
  • If the actual measurement value is higher than calculated maximum loss then most likely there will no communication or transfer data between Station A and Station B.​
On next articles  we will emphasized on
  • More calculated examples schematic diagram
  • How to measure fiber optics loss using power meter & light source
  • How to troubleshoot fiber optic link to find the exact causes of higher fiber loss.
2 Comments

    Author

    I have been in the field of fiber optics since early 1990s.  I gained fiber optics skills and knowledge via my working experience as end-user, main contractor and sub-contractor and finally as an optical fiber enterpreneur.
     

    Archives

    January 2017
    December 2016
    August 2016
    January 2016
    September 2015
    August 2015
    July 2015
    June 2015
    May 2015
    April 2015
    February 2015
    December 2014
    November 2014
    October 2014
    September 2014
    June 2014
    May 2014
    March 2014
    February 2014
    January 2014
    December 2013
    November 2013
    October 2013

    Categories

    All
    2.5mm Ferrule
    Color Blind
    Continuity
    Defective Connectors
    Defective Connectors
    Ferrule
    Fiber Breaks
    Fiber Color Code
    Fiber Optics Color Chart
    Fiber Optics Connectors
    Macrobending
    Optical Fiber Connector
    Sff
    TIA/EIA 598-A

    RSS Feed

About Us
Contact Us
Our Location
Our Fiber Optics Courses
Fiber Optics Tool Kits / Test Gears
Our Fiber Optics Blog
© 2022 Sinaran Optik
All rights reserved. 
 Be successful in fiber optics by acquiring the right Attitudes, Skills, Abilities and Knowledge
  • HOME
  • Our Services
    • Hands-ON Training >
      • 1-Hari OTDR Fiber Optik Praktikal (Melayu)
      • Ujian Kecekapan Fiber Optik
      • 1-Hari Pengujian & Pentauliahan
      • 2-Hari Fiber Optik Praktikal (Melayu)
      • 4-Hari Fiber Optik Praktikal (Melayu)
    • Sijil Kecekapan >
      • MASUK UJIAN CA
    • Accessories >
      • Patchcords
      • Pigtails
      • ProtectionSleeves
    • Test Gears & Tool Kits
    • Fiber Optics Case Studies
  • Contact Us
  • Why Us
    • Trainer's Profile
    • Our Esteemed Clients
    • Hands-ON Training Photos
    • Why Attend Our Fiber Optics Training?
  • My Blogs
    • Fiber Optics Blog
    • Biz Blog (In Malay)